Turn Leads Into a Map You Can Act On
Mapbox-powered clustering shows density at a glance. Zoom in to deep-dive into individual locations, then click any point to open a popup with the lead’s details—type, service, and address.
Clusters
Instant density view
Deep Dive
Zoom to locations
Popups
Lead details on click
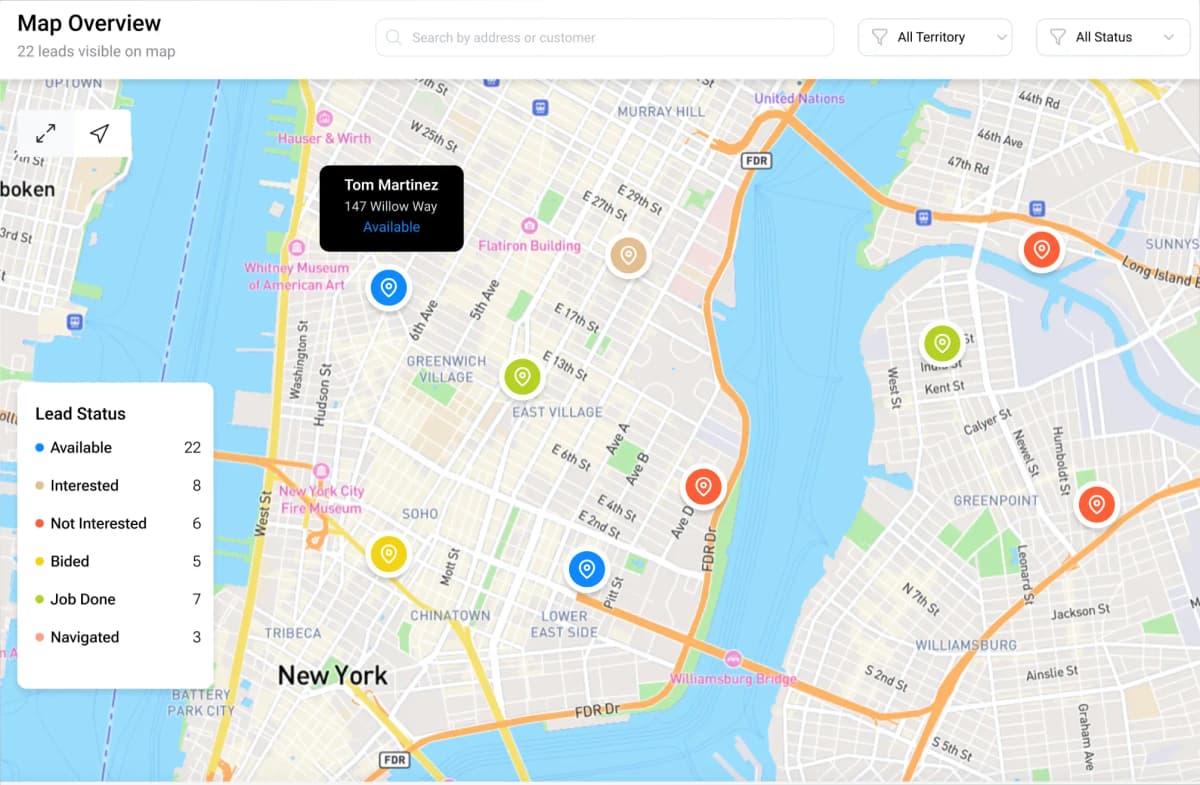
Built for Map‑Based Lead Workflows
Clustering, deep-dive exploration, and activity tracking—designed around how teams actually work with leads.
Mapbox Cluster View
See lead density instantly with smart clustering that adapts as you pan and zoom.
Deep Zoom → Locations
Zoom in to progressively reveal individual locations for precise targeting.
Detail Popups
Click any location to view a popup with lead type, service, and address details.
Lead Attributes
Clusters are created from lead data, including type, service, and address.
Weekly & Monthly Activity
Track lead creation, service selection, and key events over time—week and month views.
Fast Exploration
Move from overview to specifics quickly without losing context.
Ready to Map Your Leads?
Get a clear overview with clusters, deep-dive into locations, and keep everyone aligned with weekly and monthly activity.
- Mapbox clustering for instant density
- Click-to-open lead details in popups
- Weekly + monthly activity at a glance